Service Design & Physical prototypes
How design prototyping and physical systems revealed hidden user behaviors that surveys never could—and why Pittsburgh changed their parking policy based on what drivers actually do, not what they say.
The Challenge
Pittsburgh's Smart Loading Zones (SLZ) were designed to improve parking efficiency and reduce delivery times. But adoption was stuck. Most drivers either didn't know about them or actively avoided them. The Parking Authority had questions that surveys couldn't answer:
- Why were drivers ignoring this service despite its benefits?
- What were the actual barriers to adoption?
- What would actually change driver behavior?
Traditional research would ask drivers: "Would you use SLZ?" They'd say yes. But observed behavior told a different story entirely.
Methodology: Design as Discovery
Phase 1: Understanding the Context
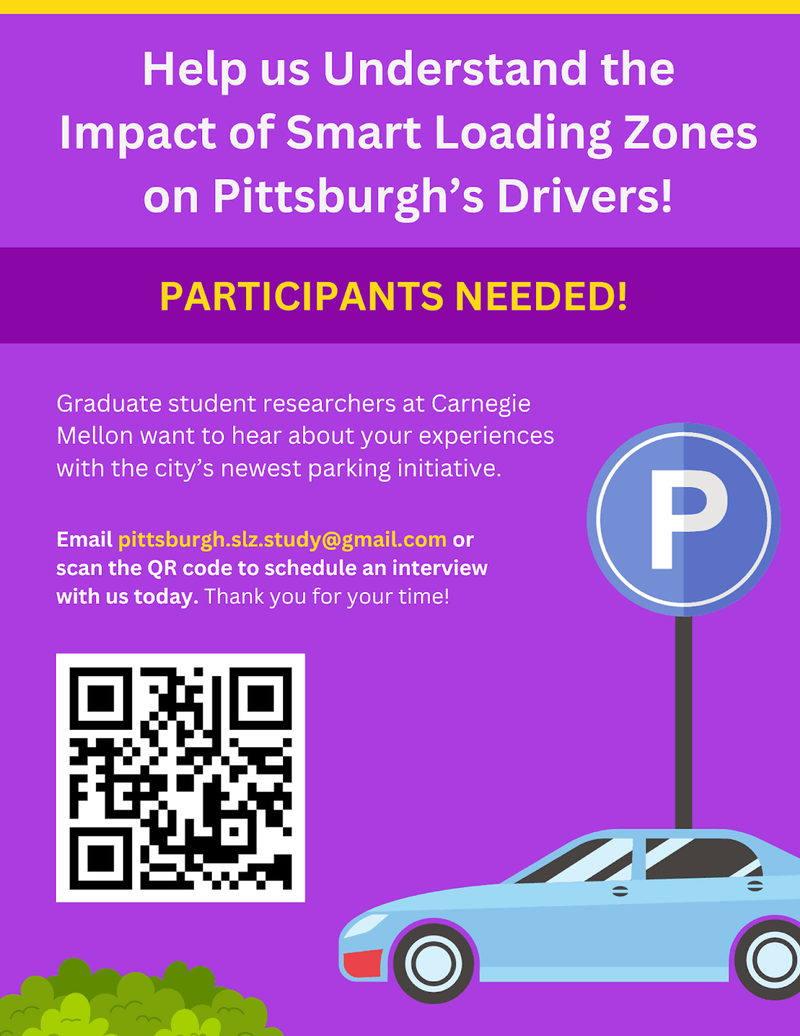
Survey Posters
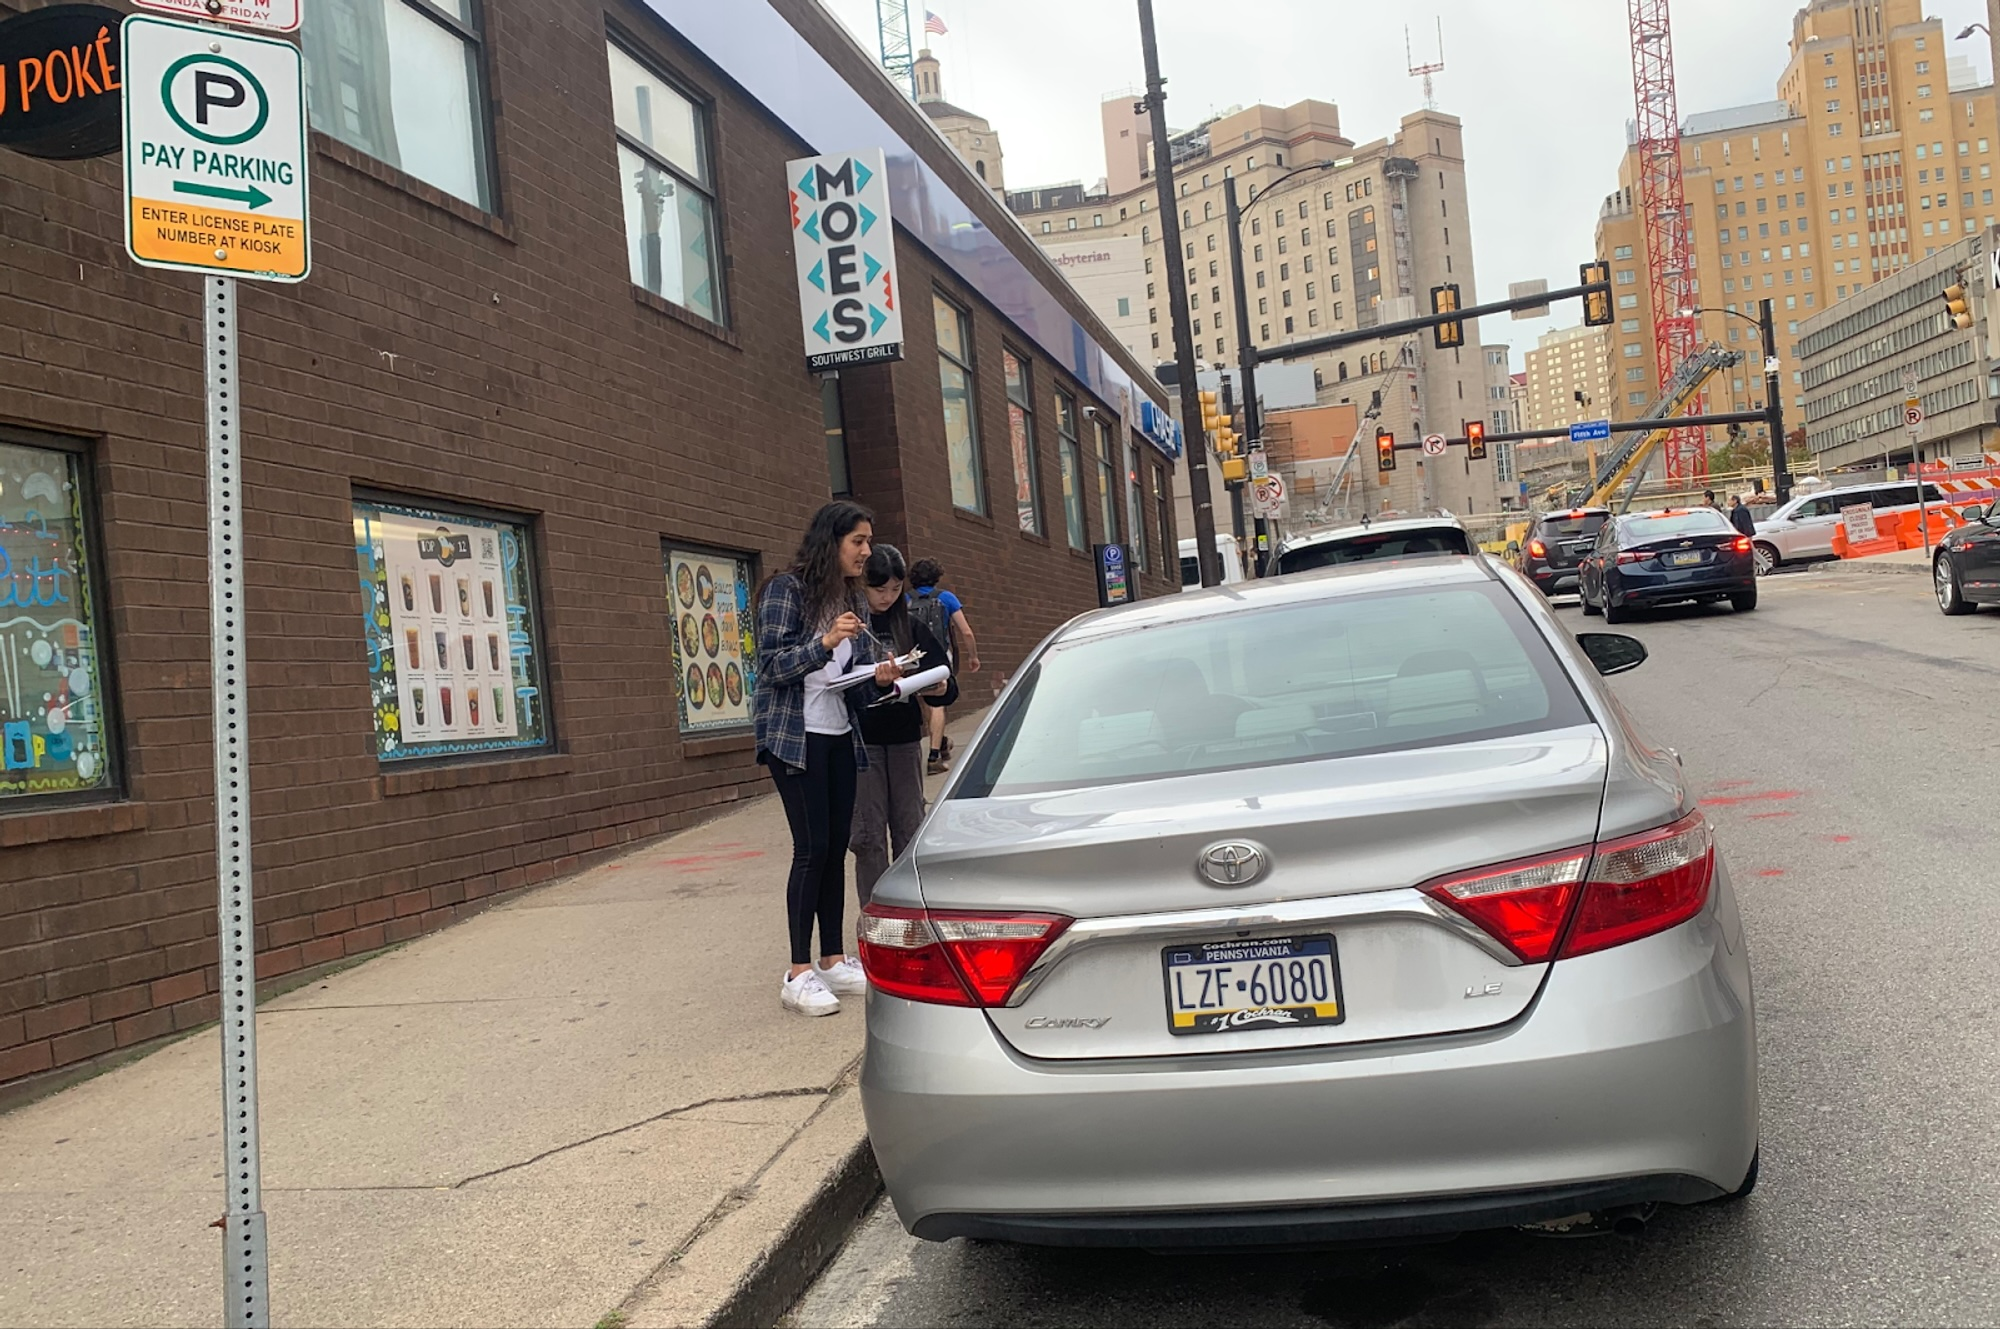
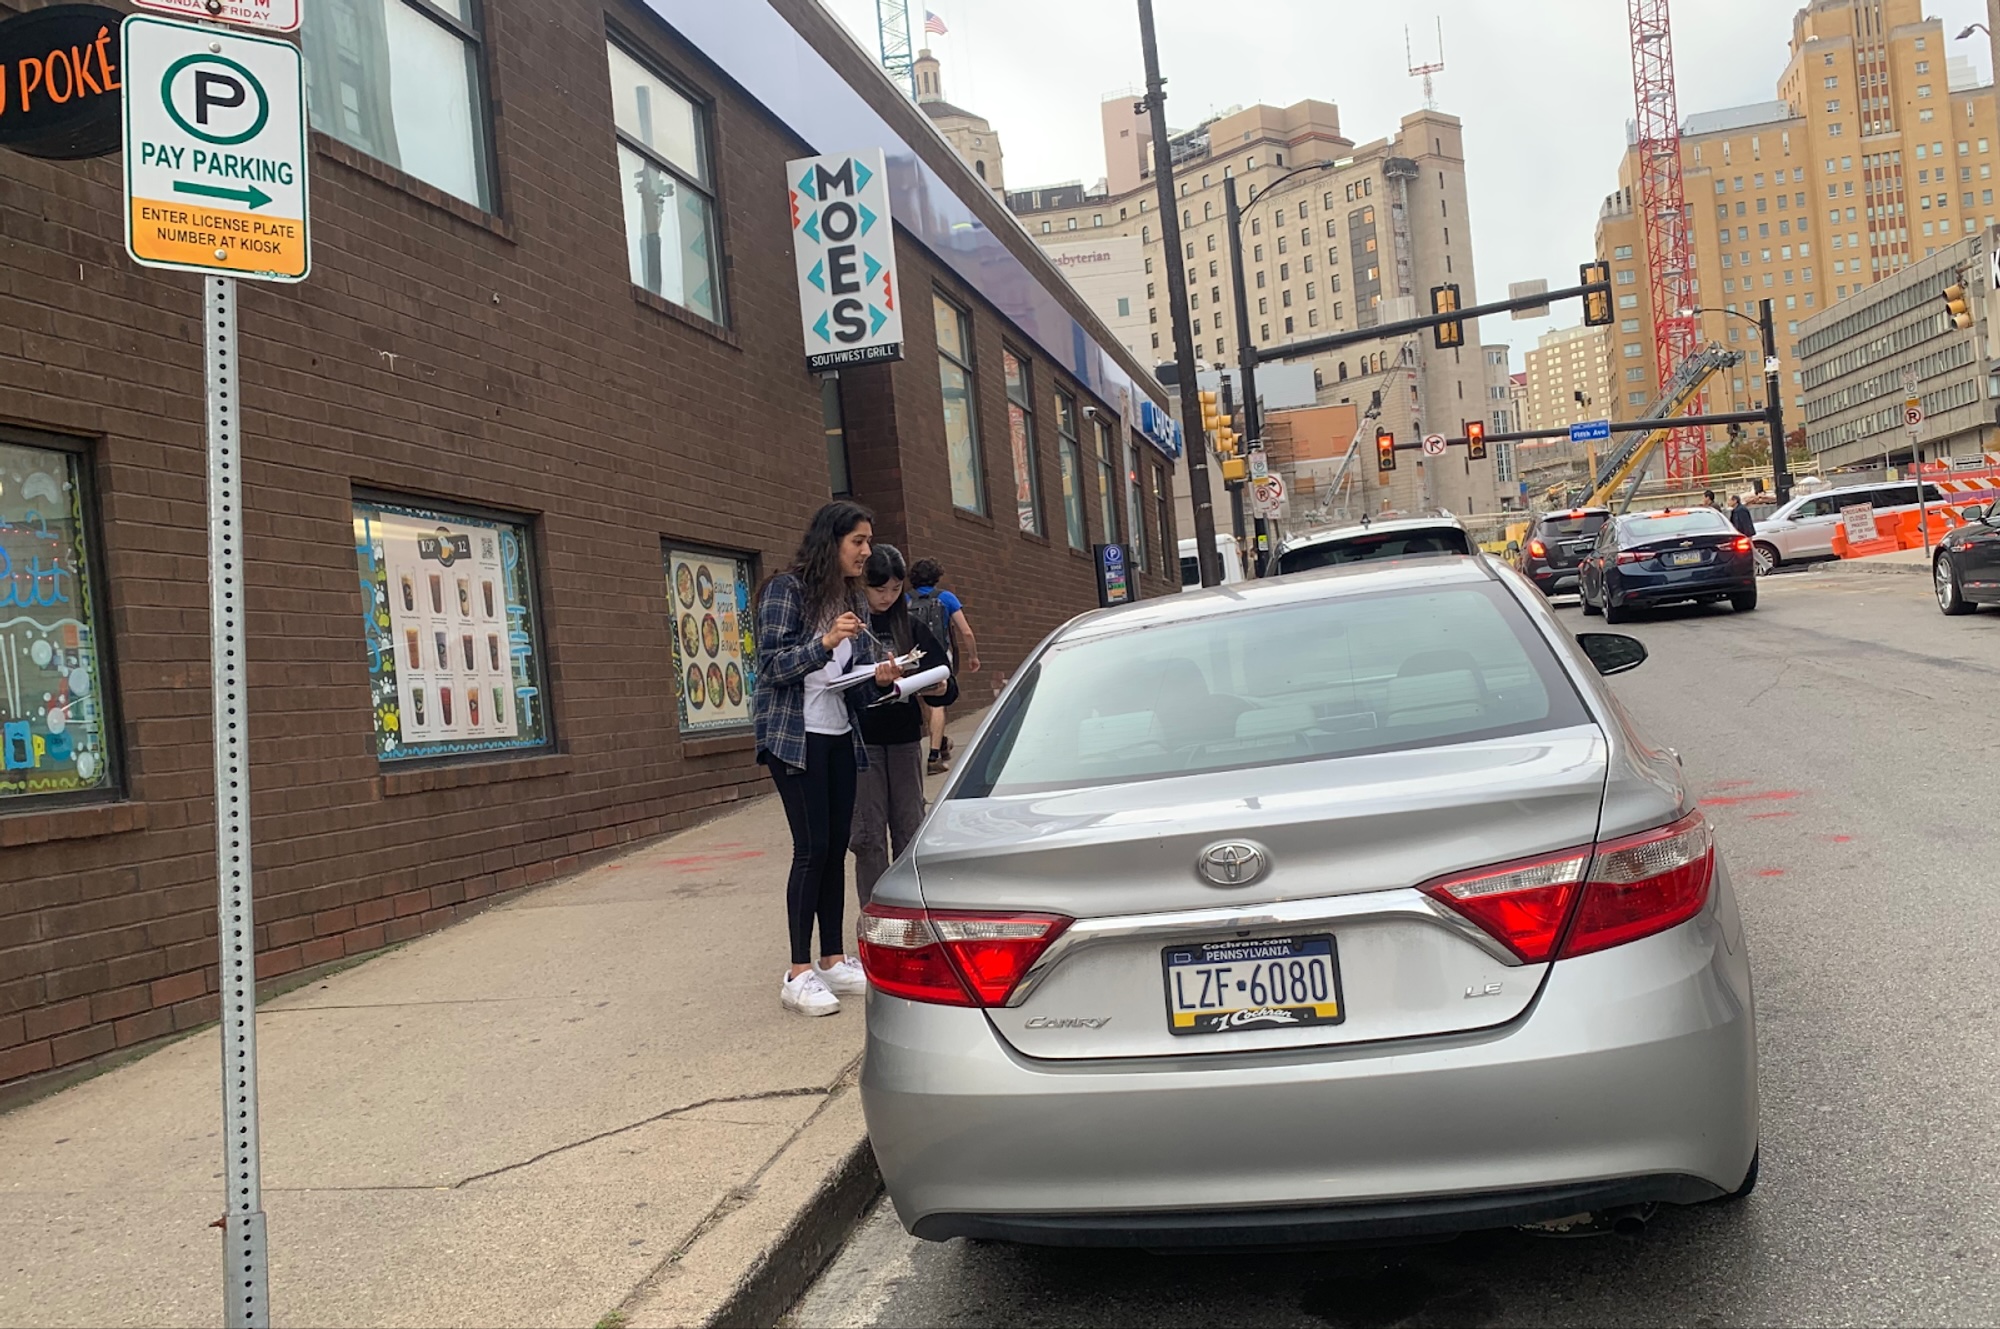
On-site Observation
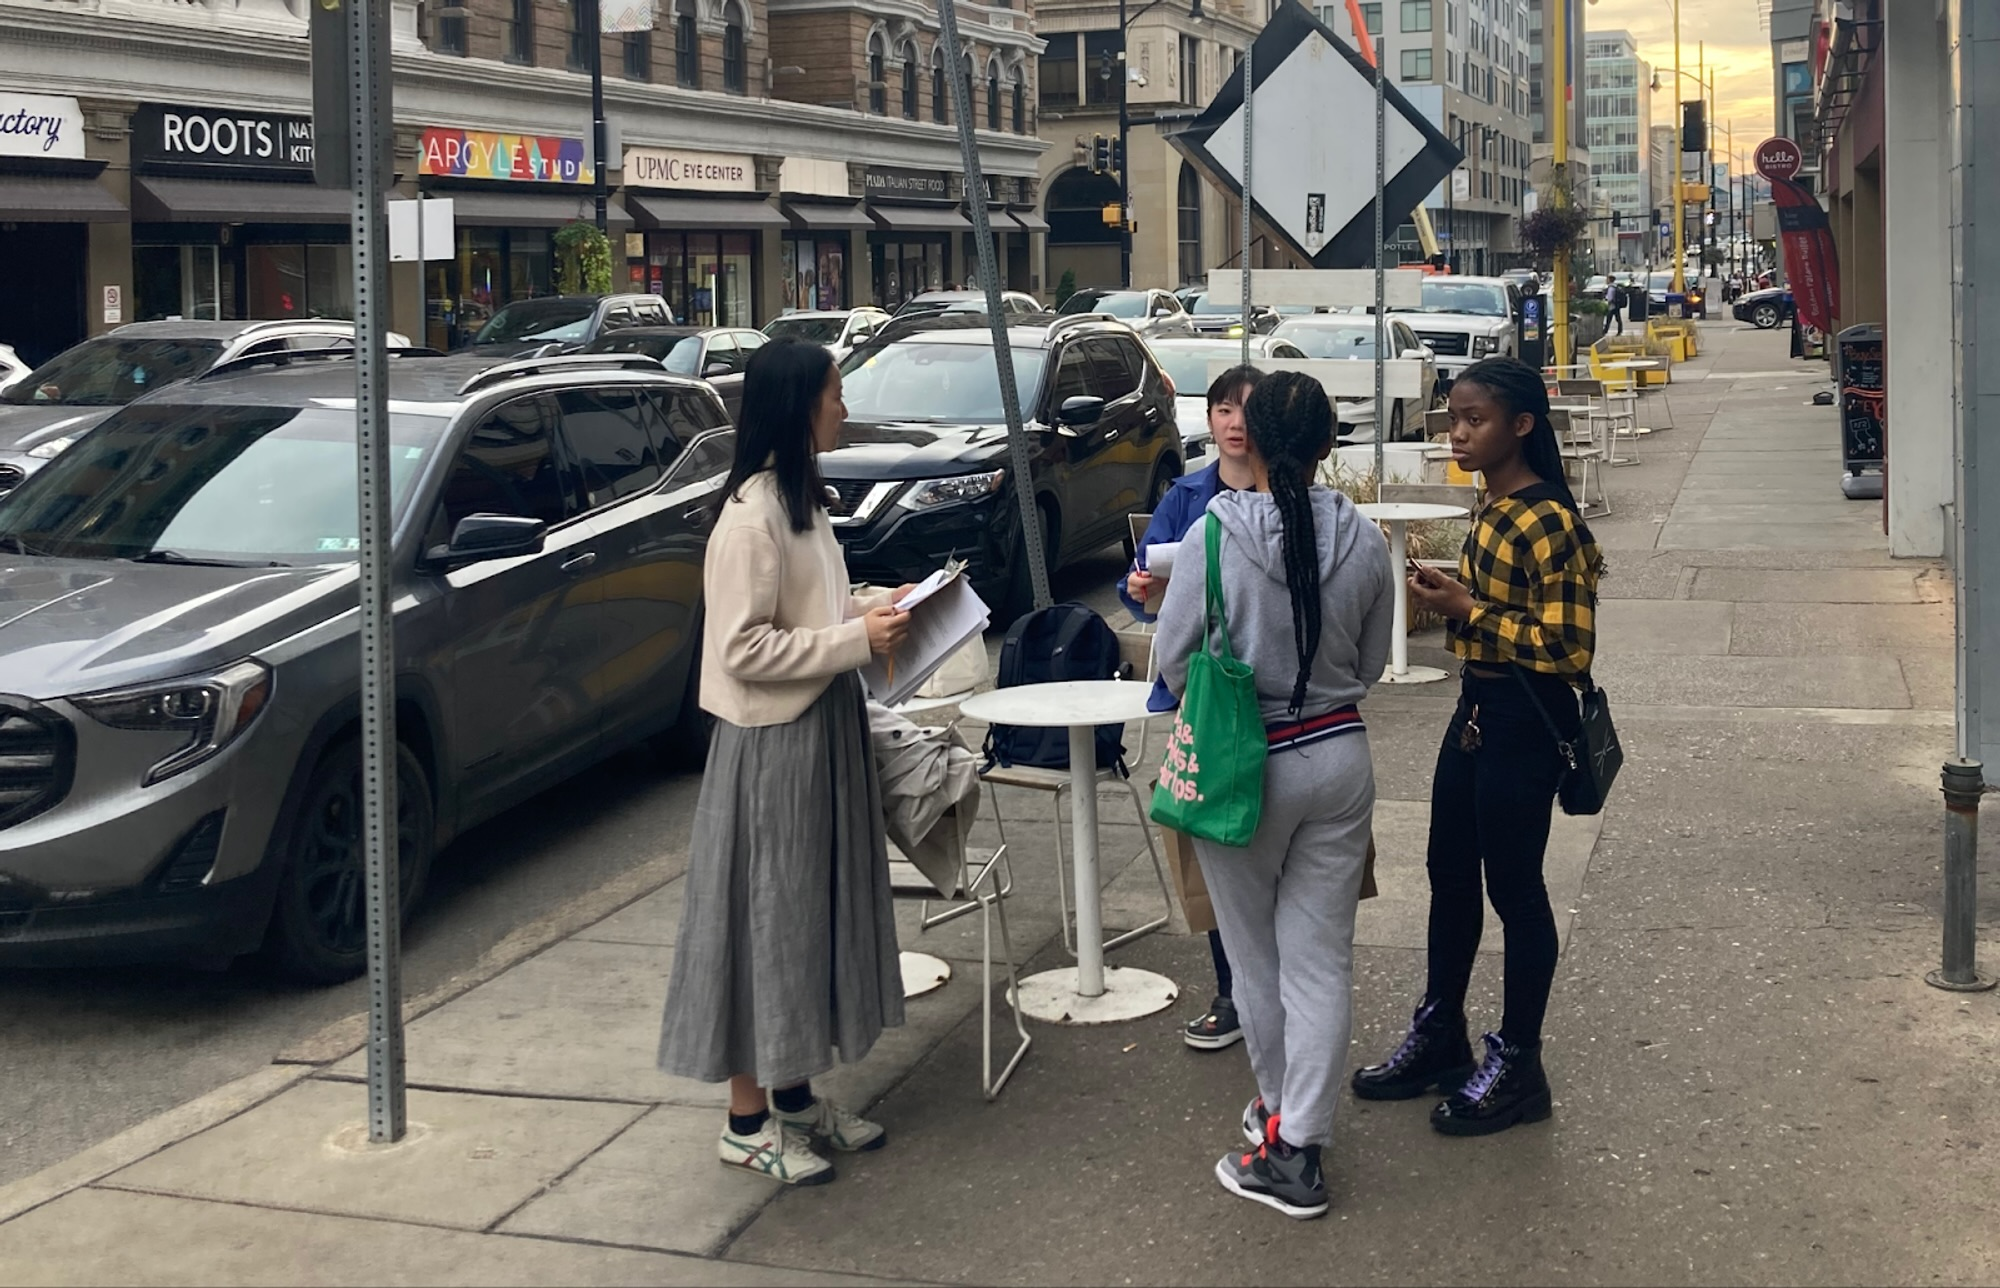
Intercept Interviews
- Desktop research — Analyzing existing SLZ systems and competitive services
- On-site observation — 10+ hours watching how drivers actually use loading zones (not how we think they should)
- Intercept interviews — 15+ unscripted conversations with delivery drivers, service workers, and regular drivers at actual loading zones
The intercept interviews were critical. We caught people in the moment, doing the actual task. They'd show us their phone (how they found spaces), their clipboard (how they tracked time), their frustrations with current apps—things they'd never mention in a formal survey.
Phase 2: Testing Assumptions with Prototypes
We built low-fidelity and high-fidelity prototypes of different service models:
- Payment timing: Upfront registration vs. pay-after-exit
- Communication: Web app vs. text-only vs. phone call
- Eligibility signage: Different visual designs for zone markers
Then we ran speed dating sessions—a rapid UX research method where drivers tested multiple concepts in quick succession. The approach tested intentionally unconventional, multimodal concepts without considering business constraints first. This technique enabled quick feedback gathering on multiple prototypes, revealing genuine reactions rather than hypothetical preferences.
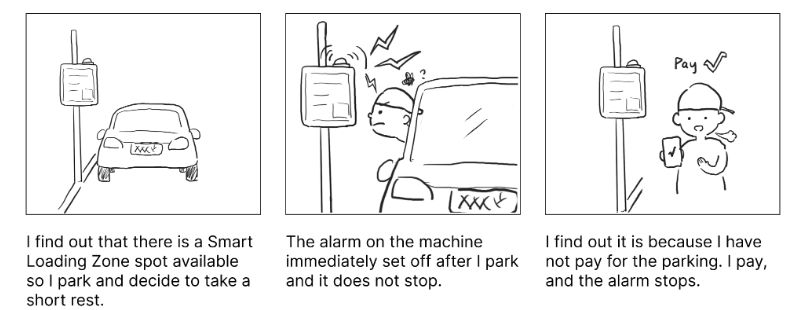
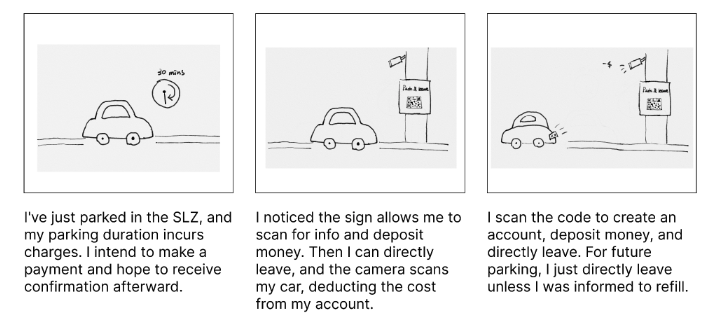
Physical artifacts from speed dating
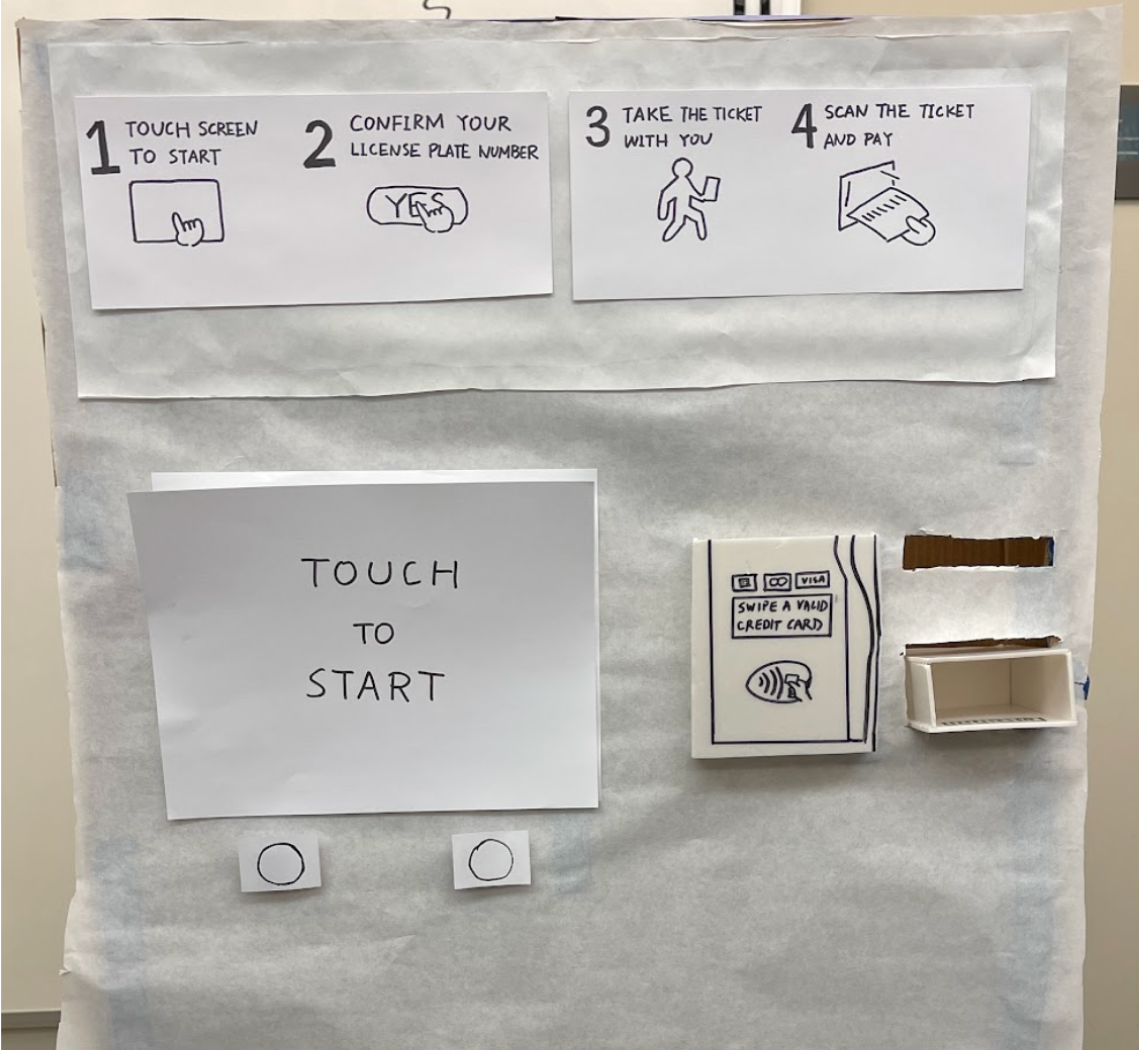
Physical Kiosk — get ticket → go on their errands → scan ticket upon return
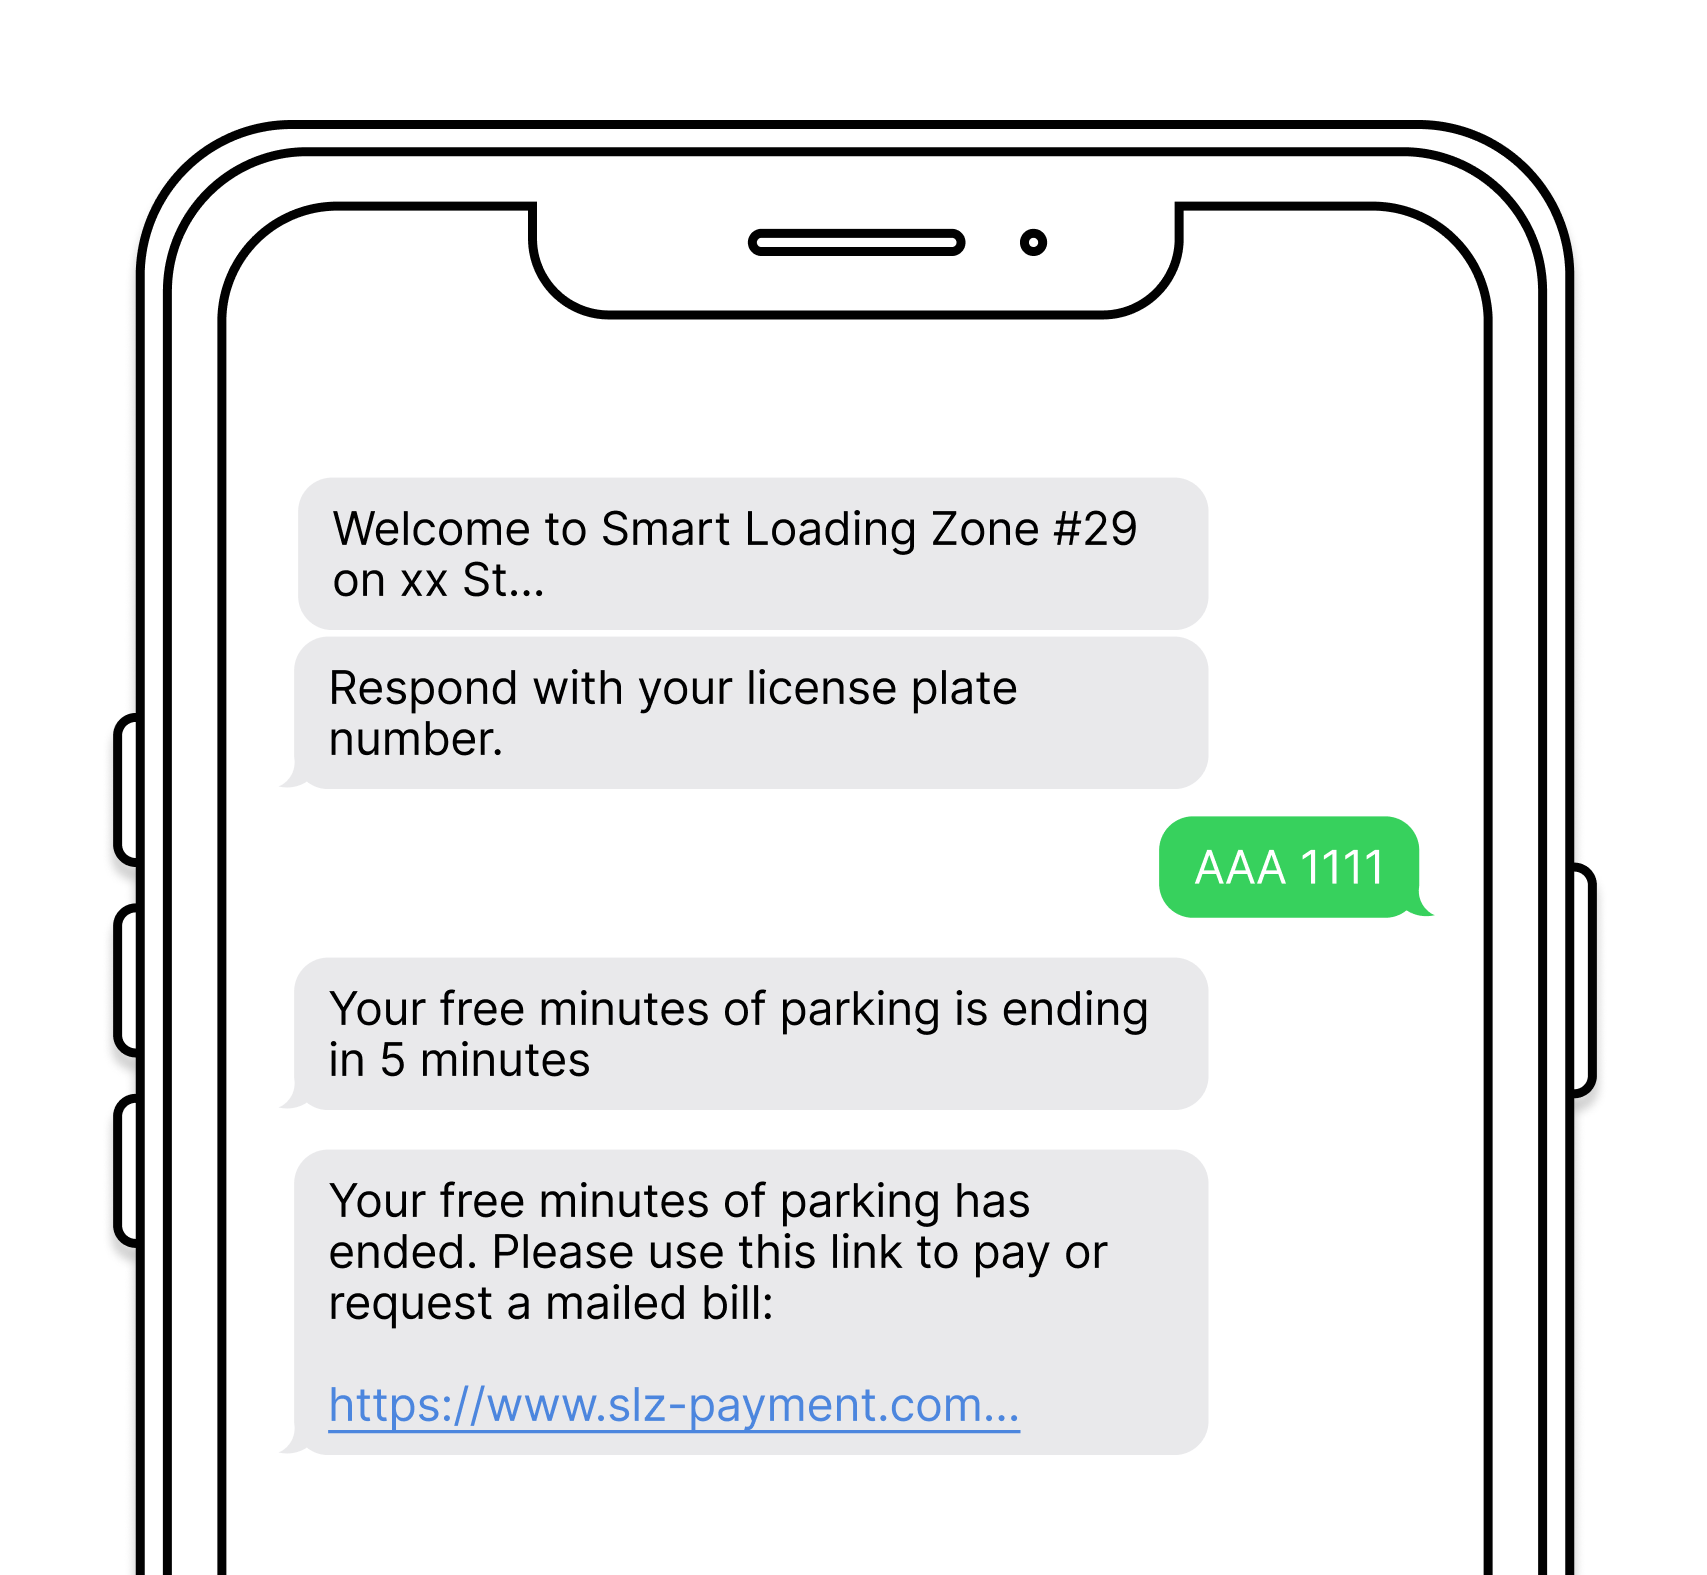
Digital Automated System — receive onboarding instructions and reminders during parking
Testing with physical artifacts

Phase 3: Validation
- Think-aloud protocol — Watching drivers interact with prototypes while verbalizing their thoughts
- SUS (System Usability Scale) surveys — Quantifying usability on a standard 0-100 scale
- Behavioral metrics — Tracking what drivers actually did, not just what they said they'd do
.png)
What Design Revealed
Survey answer: "Would you use Smart Loading Zones?" 78% said yes.
Design revealed: The actual barriers to adoption that surveys miss.
1. Awareness gap: 60%+ unaware
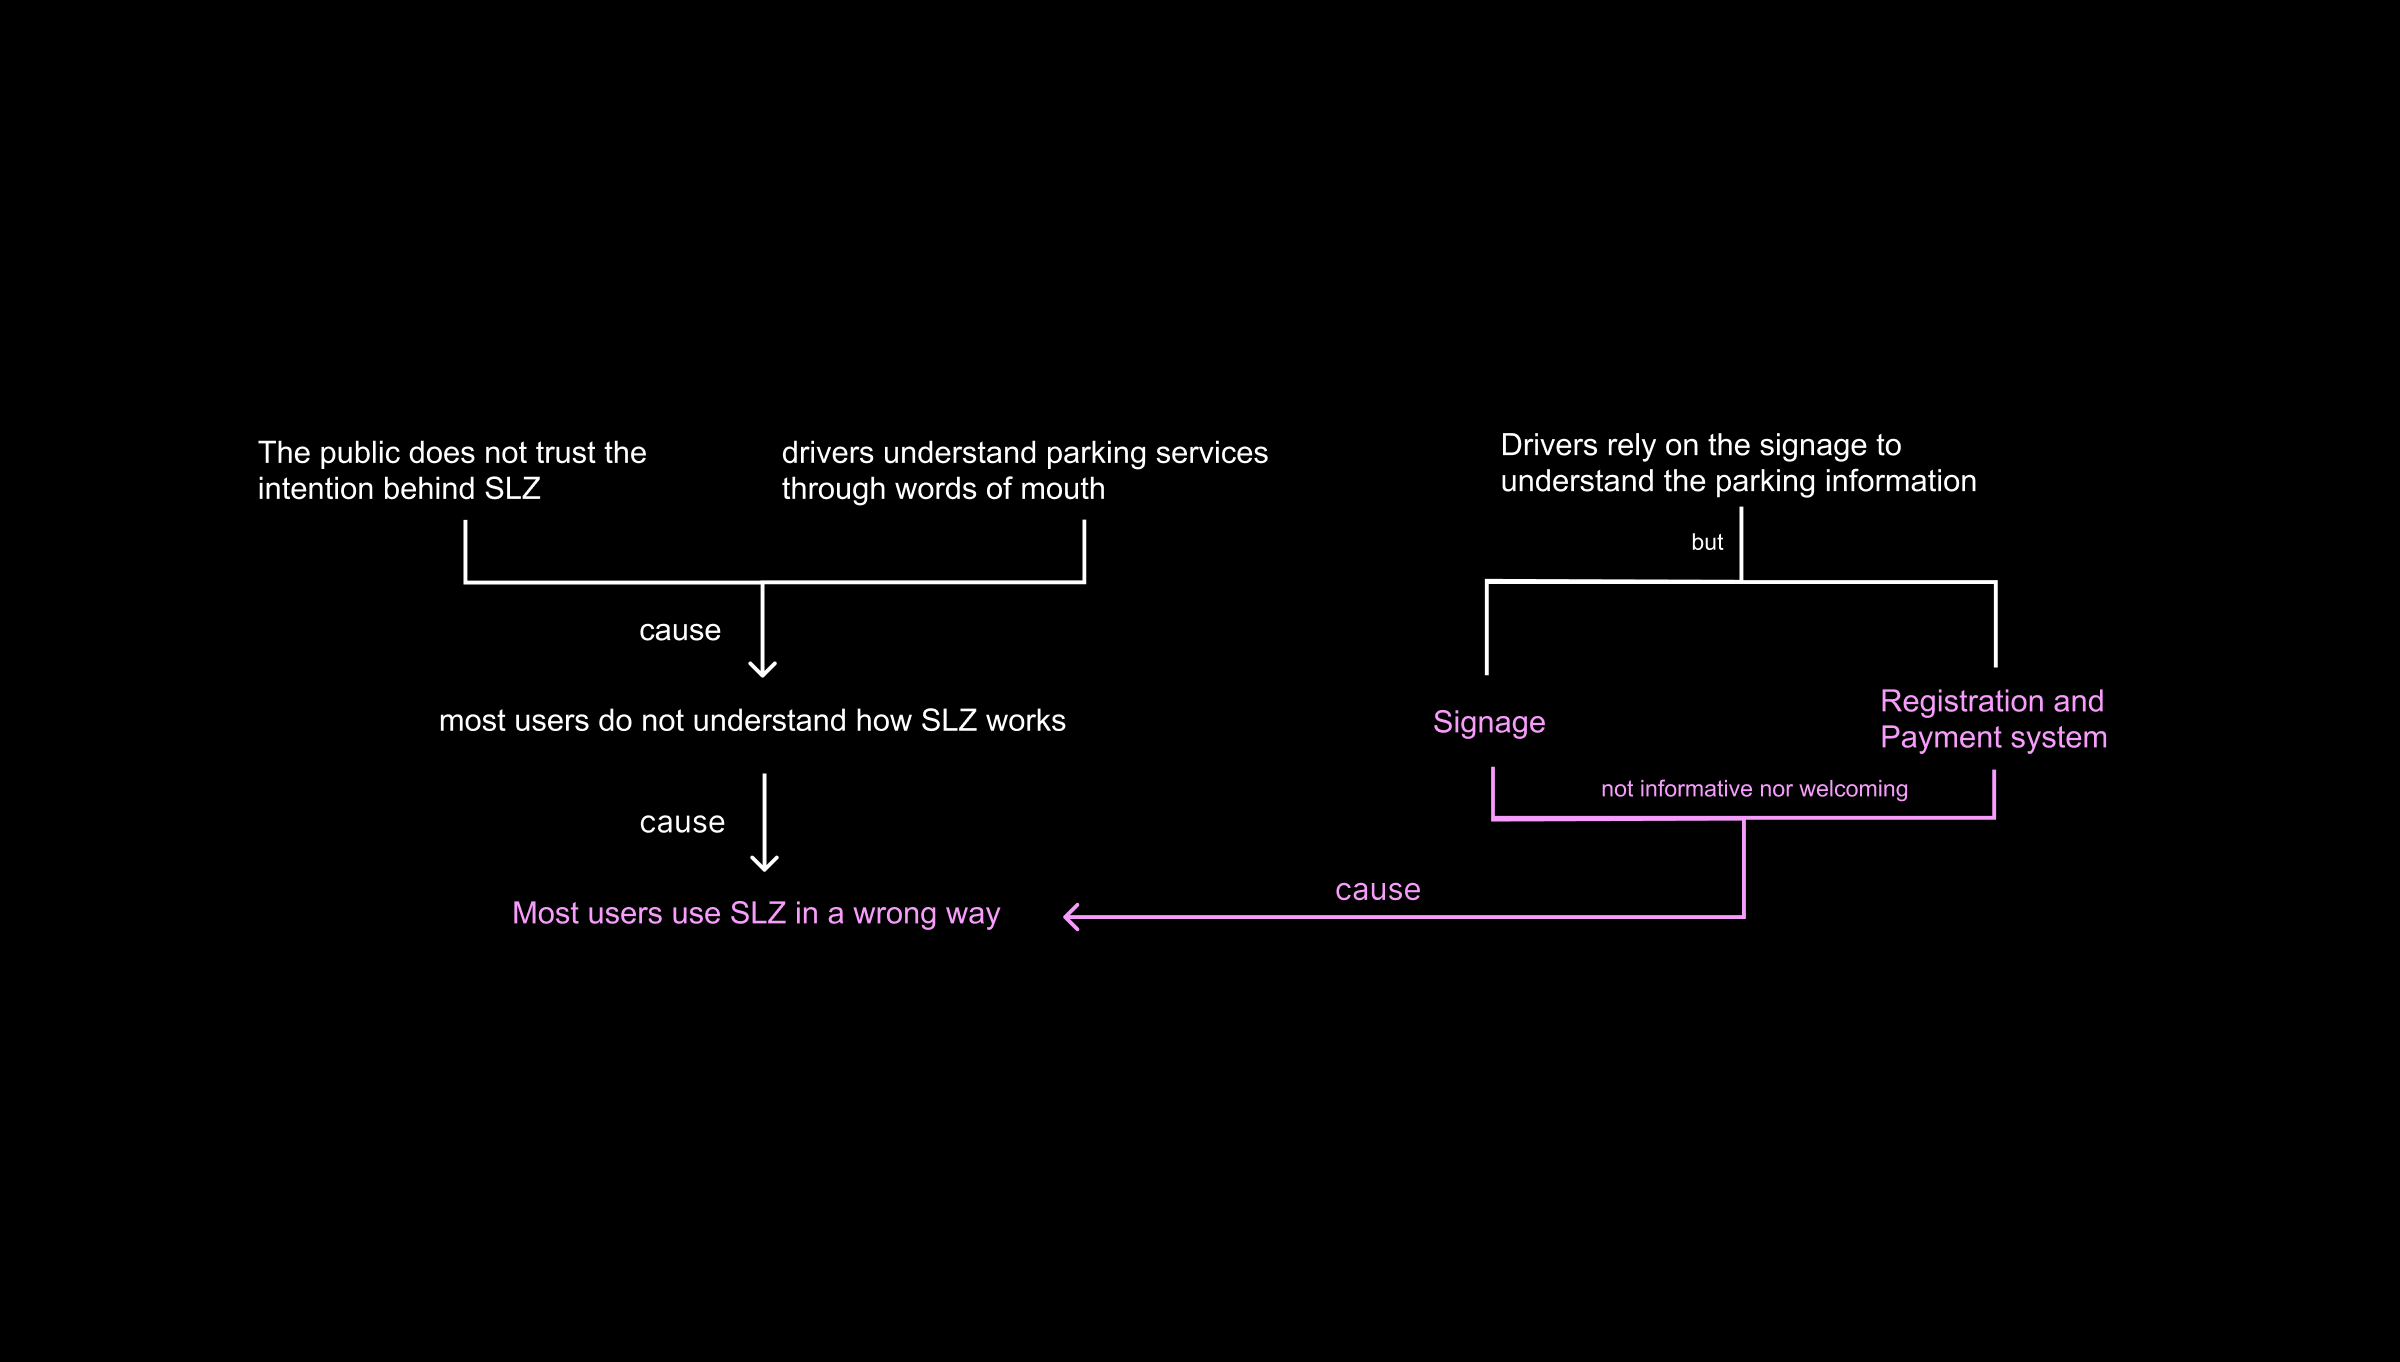
Drivers saw the purple curbs but didn't know what they meant. Signage clarity was the #1 issue.
Design implication: Information hierarchy and visibility became critical design requirements.
2. Confusion created workarounds: 95% used hazard lights
Drivers didn't understand the rules, so they defaulted to the universal signal: hazard lights. This meant they were avoiding the system, not using it.
Design implication: Rules must be immediately clear from the visual design alone.
3. Friction killed adoption: upfront commitment required
Drivers avoided unfamiliar services that required upfront registration or payment before they could test them.
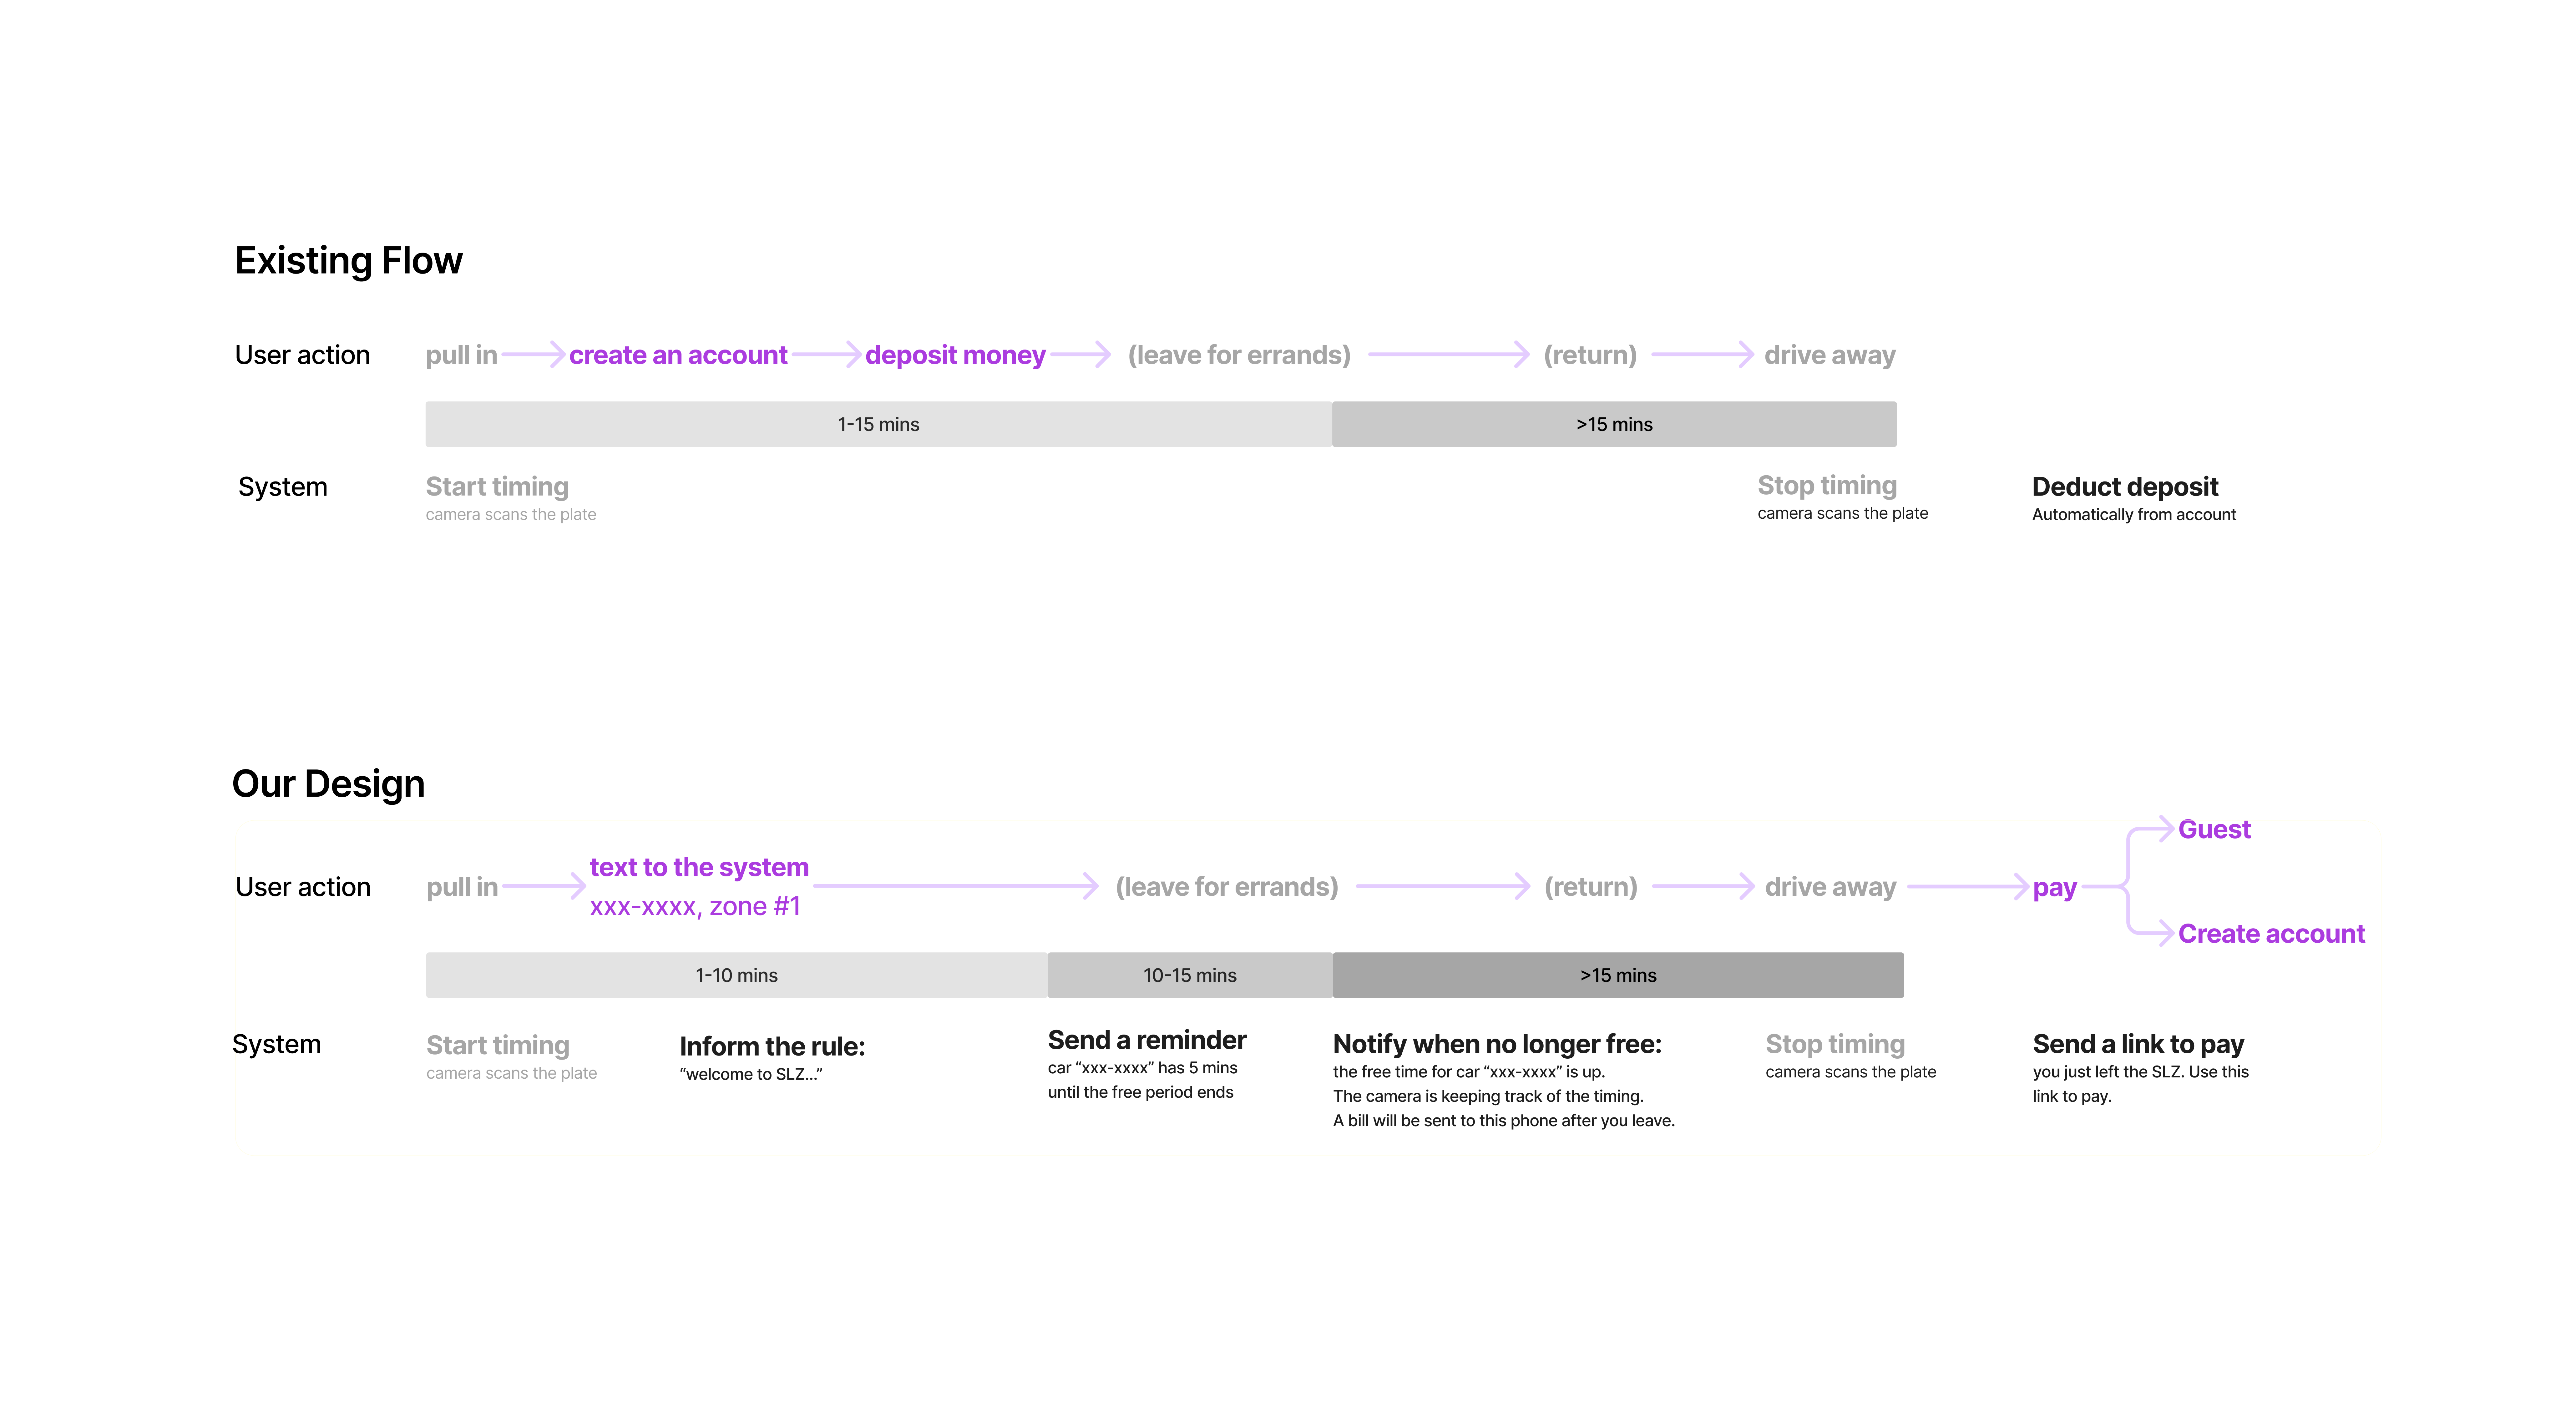
Design implication: Service model must reduce activation friction—pay after, not before.
What surveys said drivers wanted ≠ what driver behavior actually required. Design prototypes bridged that gap.
Outcome: From Research to Policy
The design research led to concrete changes in how Pittsburgh's SLZ operates:
Service Model Changes
- Shifted from upfront payment to pay-after-exit — Removing the barrier to trial
- Text-based messaging system — The fastest way to reach drivers already on the go
- Redesigned signage — Clearer, color-coded, immediately understandable
Measurable Results
- SUS score of 90.3% on final service prototype (excellent usability threshold)
- Projected 40% increase in SLZ adoption based on behavioral testing
- Reduced support calls — Clearer signage meant fewer confused drivers
Research Frameworks Used
Throughout the project, we built:
- Empathy maps — For each driver type (delivery, service, commuter)
- Journey models — Mapping the moment-by-moment decision making when approaching a loading zone
- Connection charts — Showing how pain points linked to actual adoption barriers
- Success metrics framework — Defining what "adoption" actually means behaviorally


Why Design Was Essential
Traditional research methods would have confirmed the obvious: drivers want efficient parking. But design as research revealed the non-obvious: drivers will default to hazard lights rather than learn a new system if the system seems confusing.
This insight only emerged by watching people interact with prototypes in real time. A survey could never uncover that. An analytics dashboard wouldn't show the frustration and hesitation in a driver's face. Only design—the act of making something tangible and testable—revealed what actually mattered.
Design is a research method because it forces clarity. When you prototype something, you can't hide behind vague language. "Users want ease of use" is meaningless. But a prototype forces you to specify: Which button? What color? How much text on the sign? That specificity is where insights emerge.
For the full project documentation, prototypes, and detailed research findings, visit the complete case study →